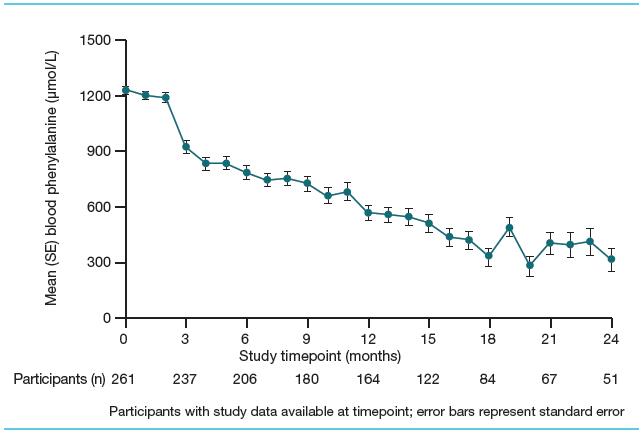
Figure 3. Mean blood phenylalanine concentration over time in the PRISM 1 and 2 trials (intent-to-treat population; n=261). Sample size reflects participants with data available at study timepoint and who have reached study timepoint at data cut. Error bars represent standard error. SE, standard error. Reproduced from Thomas J, et al, 2018.3 © The Authors. Published by Elsevier Inc under CC BY license (https://creativecommons.org/licenses/ by/4.0/)
figure 3 mean blood phenylalanine concentration
